In our daily lives we come across objects in motion. People, animals and machines often move in different directions. In this chapter we are going to study motion of objects in straight lines, the time taken for the motion to occur and the relationship between them.
Distance
Distance is the separation of two points in space. It is a scalar quantity since it has magnitude only. The SI unit of distance is the metre (m). Long distances may be measured in kilometres (km) while short distances may be measured in centimetres (cm) or millimetres (mm). It should be noted that in determining the distance between two points the direction at any point along the path is not considered. Direction may keep on changing (Fig. 1.1) or remain constant (Fig. 1.2).
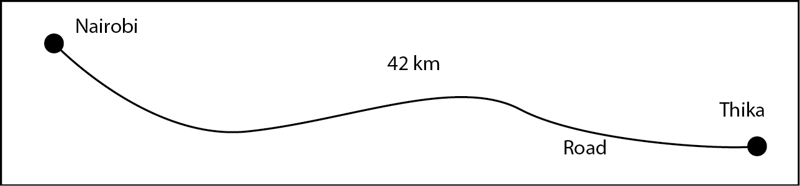
Fig. 1.1: Distance between Nairobi and Thika is 42 km
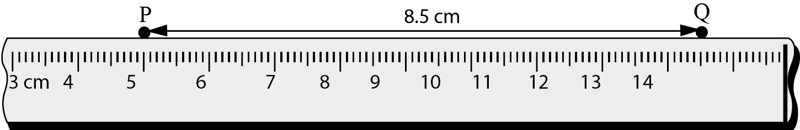
Fig. 1.2: Distance between points P and Q is 8.5 cm or 85 mm
Displacement
Displacement is the shortest distance between two points in the direction of motion. Displacement is, therefore, along a straight line. An arrowhead in diagrams indicates the direction of motion (Fig. 1.3). Since displacement has both magnitude and direction, it is a vector quantity. Displacement is defined as the distance covered in a specific direction. The SI unit of displacement is the metre (m).
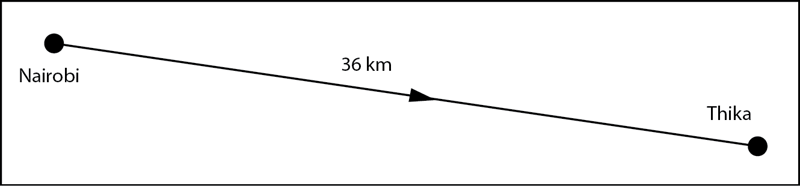
Fig. 1.3: Displacement between Nairobi and Thika is 36 km
Speed
The speed of a body is defined as the distance covered by the body in unit time. Thus
The SI unit of speed is metres per second (m/s). Other units of speed such as kilometres per hour (km/h) and centimetres per second (cm/s) are also commonly used.
When a body covers equal distances in unit time intervals, it is said to move with uniform speed. However, quite often a body moving between two points does so at varying speeds. Such a body is said to move with non-uniform speed. In such a case the speed between the two points is called average speed.
Average speed
Example 1.1
What is the speed of a racing car in metres per second if the car covers 360 km in 2 hours?
Solution
Average speed
= 50 ms–1
Example 1.2
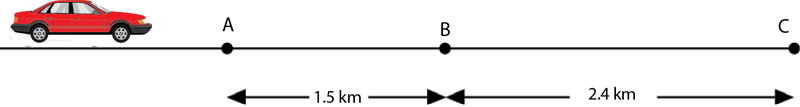
Fig. 1.4
A car moving along a straight road ABC as shown in Fig. 1.4 maintains an average speed of 90 km/h between points A and B and 36 km/h between points B and C. Calculate the:
- total time taken in seconds by the car between points A and C.
- average speed in metres per second of the car between points A and C.
Solution
Velocity
The speed of a body in a specified direction is called velocity. Therefore:
velocity
or
Velocity is defined as the displacement covered in unit time i.e the rate of change of displacement. Velocity is a vector quantity. In some cases, the velocity of a moving body keeps on changing. In such cases, it is better to consider the average velocity of the body.
Average velocity
The SI unit of velocity is metres per second (m/s). The direction of velocity should always be indicated.
Example 1.3
A car travelled from town A to town B 200 km east of A in 3 hours. The car changed direction and travelled a distance of 150 km due north from town B to town C in 2 hours. (Fig. 1.5).
Calculate the average
- speed for the whole journey.
- velocity for the whole journey.
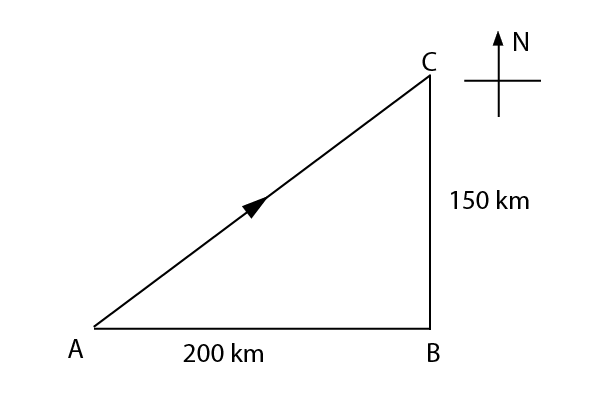
Fig. 1.5:
Solution
(a) Average speed
= 70 km/h
(b) Average velocity
= 50 km/h
Direction is from A to C
Measurement of velocity
Velocity of a moving object can be determined in a number of ways. One of the methods is to use a ticker-tape timer.
The ticker-tape timer is an electrical vibrator which moves a metal pin up and down 50 times every second (Fig. 1.6 (a)). This means that the time taken for one complete vibration is 0.02 s. Each time the pin moves downwards it presses on a carbon paper disc and makes a dot on the paper tape which passes underneath the carbon. The tape is attached to a moving body e.g. a trolley as shown in Fig. 1.6 (b). Each successive pair of dots represents a time interval of 0.02 s. The distance between any two successive pair of dots is the distance the object has moved in 0.02 s. The tape, therefore, records the distance moved and the time taken by a moving body.
(a)
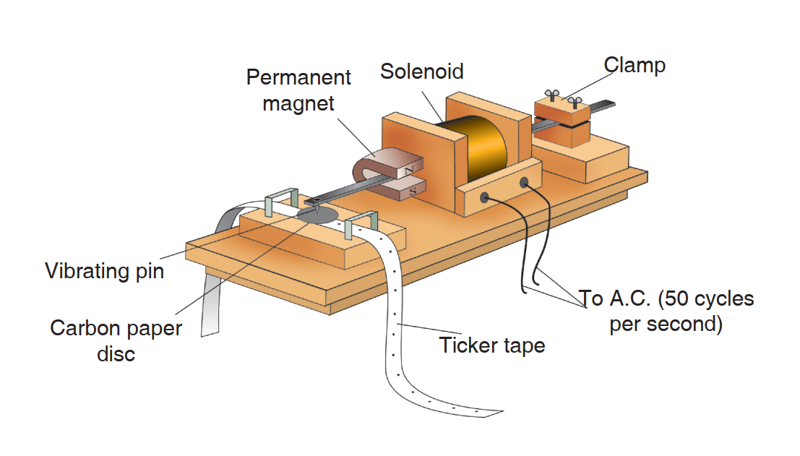
A ticker-tape timer
(b)

Tape and trolley
Fig. 1.6: A paper tape attached to a moving trolley
Experiment 1.1: To determine velocity of a trolley
Pass a long tape under the carbon disc of the ticker-tape timer and attach it to a trolley. Place the trolley on a horizontal runway. Displace the trolley slightly along the runway. What happens to it? (It moves a short distance and then stops due to friction).

Fig. 1.7: To determine uniform velocity using a ticker-tape timer
Tilt the runway gradually until the trolley just moves down the whole runway without stoppings. Fix the runway in this position with support as shown in Fig. 1.7.
The runway is now said to be friction compensated. This means that the force of friction does not play any part in the experiment.
Place the trolley at the top of the runway and start the ticker-tape timer. Release the trolley to move down the runway. Remove the tape from the trolley and examine the dots made on the tape.
Cut the tape into portions containing 5 spaces. Stick the side of the portion by side to obtain a tape chart as shown in Fig. 1.8.
Each portion represents the distance travelled in 0.10 s (5 × 0.02 s). The constant height of the portions means that the tape was covering equal distance in equal time i.e. moving with uniform velocity as indicated by line AB. Measure the height OA.
Equal sections of ticker tape with equal number does mean the body is moving at constant velocity.
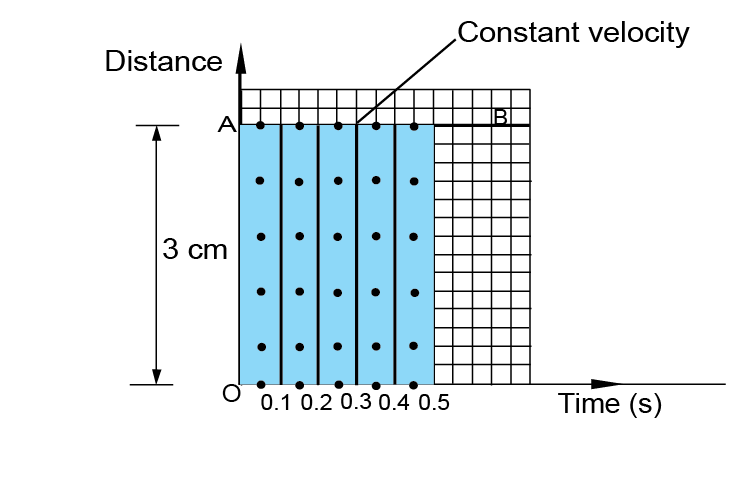
Fig. 1.8: Tape chart (Distance axis not to scale)
Determining velocity using a ticker-tape timer
Consider the ticker-tape shown in Fig. 1.9. Measure the distances AB, BC, CD, DE, EF, FG, GH, HI. What can you say about these distances? (All these distances are equal. They are distances the tape moves in equal intervals of time). What is the distance PQ? (3.0 cm). What is the time taken by the tape to travel the distance PQ? (As there are 5 spaces between P and Q, the time taken by the tape to travel the distance PQ is 5 × 0.02 s = 0.10 s).
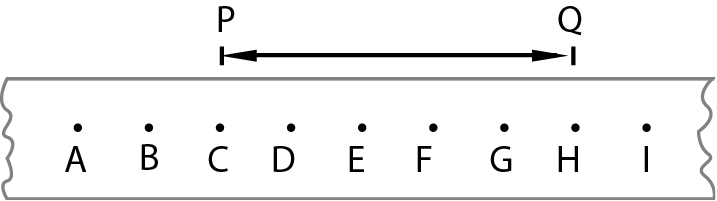
Fig. 1.9: Ticker timer tape (velocity)
Calculate the velocity between points P and Q.
Velocity of the tape
Since the dots are equally spaced this velocity is the same at all points on the tape. The body has uniform velocity.
Acceleration
When the velocity of a body changes the body is said to be accelerating.
Acceleration is defined as the rate of change of velocity with time.
Acceleration
The SI unit of acceleration is metres per square second or ms-2. Acceleration is a vector quantity. If the acceleration of a body is 4 ms-2, it means that its velocity is increasing by 4 m/s every second. When the velocity of a body decreases, it is said to be decelerating or retarding. Deceleration or retardation is a negative acceleration.
Example 1.4
A car accelerates from rest to a velocity of 20 m/s in 5 s. Thereafter it decelerates to rest in 8 s. Calculate the acceleration of the car.
- In the first 5 s.
- In the next 8 s.
Solution
Experiment 1.2: To determine the acceleration of a trolley
First ensure that the runway is friction compensated as in Experiment 1.1. Now increase the angle of inclination using the wooden block until the trolley is observed to be moving with increasing speed down the runway. Attach a long paper tape to the trolley (Fig. 1.7). Release the trolley and start the ticker-timer. What do you notice about the separation of adjacent dots on the tape?
It can be seen that the separation increases with time as shown in Fig. 1.10. Cut the tape into portions containing 5 spaces each. Since the time between two successive dots is 0.02 s, the time between each 5 spaces length is 0.10 s.

Fig. 1.10: Ticker-tape for an accelerating body
Stick the side of the portion by side in the right order to obtain a tape chart as shown in Fig. 1.11. What do you notice about the lengths of the tape portion?
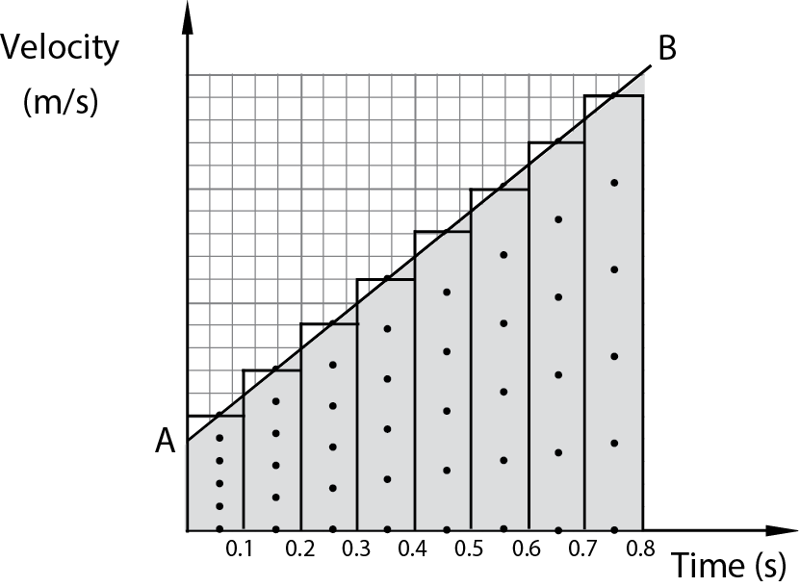
Fig. 1.11: Tape chart for constant acceleration
Each portion represents the distance travelled in 0.10 s. The tape chart shows that the velocity of the trolley down the runway was increasing. This means that the trolley was accelerating.
Determine the gradient of line AB. The straight line AB has a constant gradient which shows that the acceleration was constant. The gradient of the line is equal to the acceleration of the trolley.
Instantaneous velocity
The velocity of a body at a specific moment in time is called the instantaneous velocity.
Determining the instantaneous velocity of a trolley
Consider the tape given in Fig. 1.12 produced in an experiment using a ticker-tape timer. The instantaneous velocity of the trolley at A and B may be calculated as follows:
Measure the distance between the dots A1 and A2, the dots preceding and after point A respectively. Divide the distance A1A2 by the time taken to travel that distance A1A2 to get the velocity at point A.
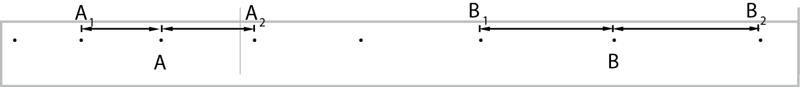
Fig. 1.12: Ticker-tape
Thus velocity at point A =
Similarly velocity at B =
Determining constant acceleration of a trolley
The tape of Fig. 1.13 was obtained for a trolley moving with constant acceleration.
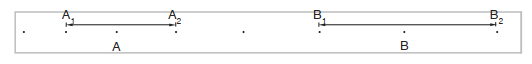
Fig. 1.13: Ticker-tape
Let the velocity of the trolley at points A and B be vA and vB respectively.
Thus
Acceleration between A and B =
Example 1.5
Fig. 1.14 shows the motion of a trolley on a ticker-tape.
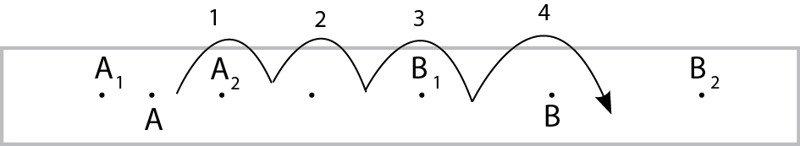
Fig. 1.14
- Find the velocity at points A and B.
- Calculate the acceleration between points A and B.
Solution
Exercise 1.2
- A student cycles to school 2.5 km away in 5 minutes. What is the student’s average speed in (a) metres per second (b) kilometres per hour.
- Fariba and Mohamed decided to walk to a picnic site 12 km away. They walked the first 6 km at an average speed of 6 kmh–1 and the rest at 5 km/h.
- How long did the journey take?
- What was their average speed for the journey?
- The initial velocity of a motor cyclist riding on a straight road is 10 m/s. If the velocity is increasing by 5 ms–2 every second, find;
- the velocity after
- 1 s
- 2 s
- 5 s
- the average velocity in 5 s?
- the velocity after
- Fig. 1.15 shows a section of the motion of a trolley on a ticker-tape. The ticker-tape timer makes 50 dots in one second.
- Use the tape to describe the motion of the trolley.
- Calculate the speed of the trolley.

Fig. 1.15
- Fig. 1.16 shows the motion of a trolley obtained using a ticker-tape timer which makes 50 dots in one second.
- Find the velocities at points A and B.
- Given that the motion of the trolley has a constant acceleration use your answer to part (a) to determine the acceleration of the trolley.
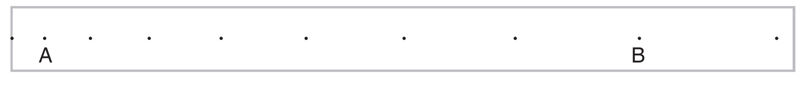
Fig. 1.16
- Fig. 1.17 shows a pattern of oil drops on the road leaking from a moving vehicle. If the drops are separated by 4 second intervals. Calculate;
- the velocity between A and B
- the acceleration between A and D
- the velocity between C and D
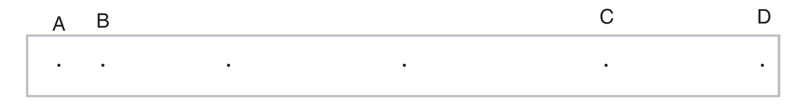
Fig. 1.17