Map Reading and Interpretation
Map reading is the study of maps and extracting information from them. We learnt in the previous classes that maps are drawings on paper to represent various sizes of land surfaces. Maps are smaller than the areas they represent. This means that maps representing large areas such as the world and the continents will show fewer details to avoid it being crowded. Such maps show general information and are likely to leave out certain messages required of that area. On the other hand, maps representing smaller areas such as a school, home or a village, are likely to show more details of the features found on the ground.
When drawing maps, not all features on the ground will be shown. The person drawing the map decides on the features to be shown and those to be left out, depending on the information required on the map. For example, if the map is intended to show the distribution of population in Kenya, then roads or ports need not be shown. The reader of the map is therefore, expected to look for and read out only the information shown on the map without adding any other information.
- A village map showsdetails than a world map.
- Maps arethan the areas they represent.
Use of Symbols to Read and Interpret Maps
It is not possible to draw on the map all the features seen on the ground. Symbols are therefore drawn on maps to represent different features found on the ground. The symbols may be dots, marks, letters or small drawings, to represent the real things found on the ground. All the symbols drawn on a map are arranged neatly on the sides or at the bottom of the map, showing the features they represent. This arrangement of symbols and the features they represent is known as the key of the map. Just like an ordinary key opens a door to a room, the key on a map opens up information about the map to the person reading it, that is, the key helps the reader to tell the information found on the map. It is possible to know what features symbols represent on the map by reading the key.
The key of the map helps the reader, to …
- draw symbols on the map.
- tell the information found on the map.
- open the library.
The symbols drawn on a map are found (more than one correct) …
- on the sides of the map.
- in the middle of the map.
- behind the map.
- at the bottom of the map.
Conventional symbols are …
- created by the person reading the map.
- decided by the person drawing the map.
- internationally accepted.
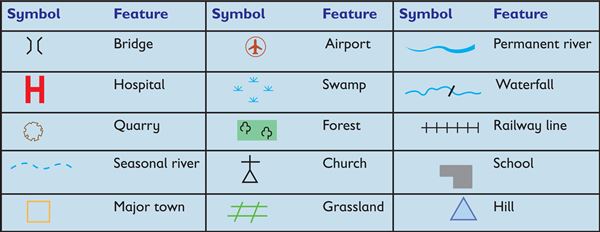
Different symbols are used or drawn on maps. Some symbols are decided by the person drawing the map, while others are internationally accepted to represent certain features. Internationally accepted symbols are known as conventional symbols. Conventional symbols include those used for an airport, church, bridge, hill, quarry, waterfall, hospital or capital city. Figure 1.1 shows some of the conventional symbols used on maps.
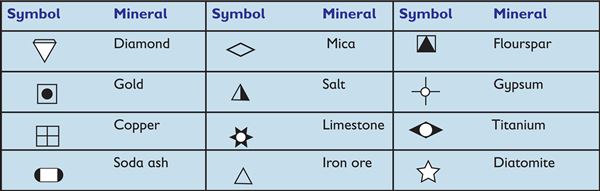
Symbols showing distribution of minerals
A map showing distribution of minerals will use conventional symbols for minerals as shown in figure 1.2 below.
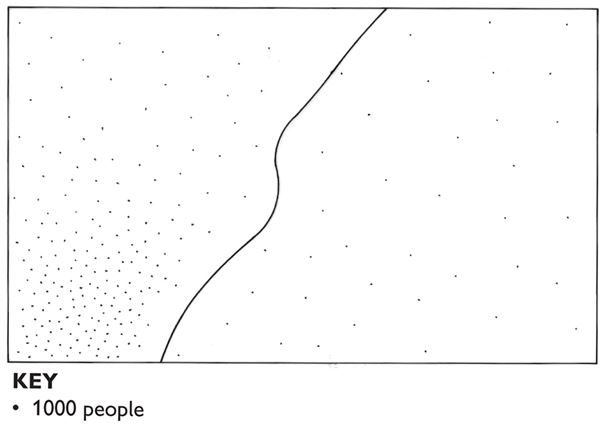
Symbols showing population distribution
In order to show the distribution of population, dots may be drawn to represent the number of people in the area. Each dot will represent the actual number of people making it easy for the reader of the map to know the number of people, by counting the dots and multiplying them by the number they represent. Dots may also be used to show distribution of livestock in an area, as shown in figure 1.3.
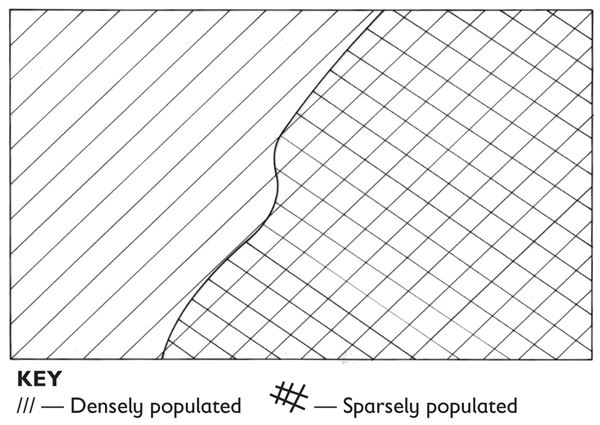
Population distribution may also be shown by using shades or patterns. The shades/patterns may show the densely or sparsely populated regions in an area as shown in figure 1.4.
Which one is not used to show population distribution on a map?
- shades
- dots
- compasses
- patterns
The reader of the map will find out the number of people by
- adding up the dots
- counting the dots
- multiplying the dots by the number they represent
Symbols showing distribution of crops
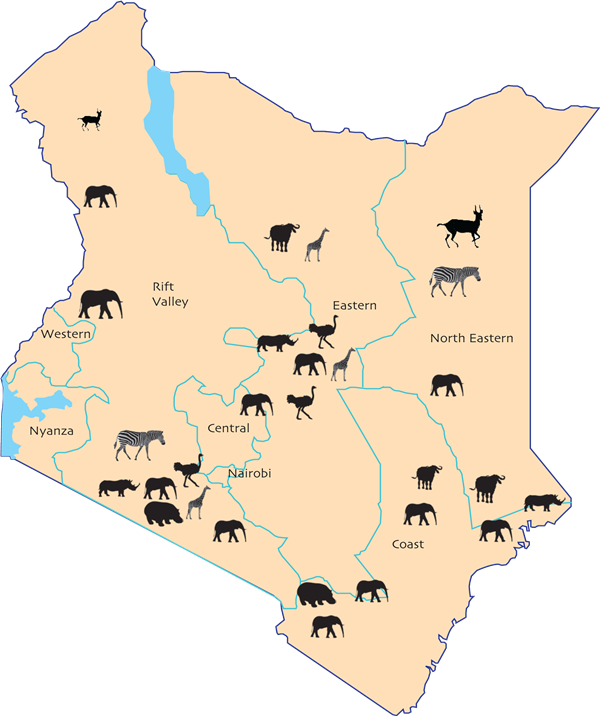
A map showing the distribution of crops or wild animals found in an area may have small drawings of the crops or the animals. For example, a map of Kenya may show the crops or animals in different parts, by having the actual crops or animals drawn at specific areas as shown in figure 1.5.
A good interpretation of a map requires that you study the map before reading the symbols shown on the key. It is important that you go over the map and identify the symbols used to represent the different features. Thereafter, relate the features on the map to the symbols on the key. You should not read the key before studying the map. This is because some keys contain symbols of features not found in the map you are studying.
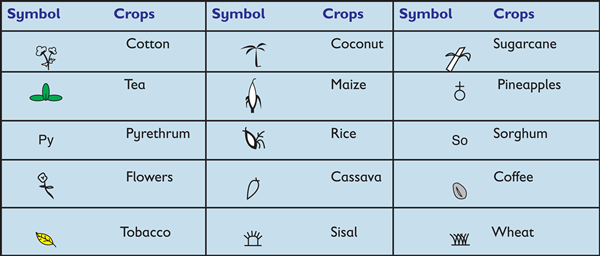
Beginning to read the key, may lead you to make wrong interpretations about the map. Some of the symbols used for crops are shown in figure 1.6 below.
- Tea
- Church
- Hospital
- Airport
- Flowers
- Gold
- Coffee
- Cotton
- Limestone
- Diamond
- Railway line
- Iron ore
- Maize
- Forest
- Titanium
Finding direction of places using compass points
The compass, usually drawn on the right side of the map, can assist you to find out the direction of one place from another on the map. On each map, there is a compass with an arrow () pointing to the North direction. Even where a compass is not drawn, all maps are always drawn facing the North direction. Consequently, the top of the map represents the North direction.
You can tell the direction of one place from another on a map using compass points. You can do this by drawing a compass showing the 4, 8 or 16 points of direction. In figure 1.7, we can tell the direction of E from F, by taking the following steps:
- Draw a compass at F.
- Extend the compass points, to pass near or through E.
- Read out the direction of E from F
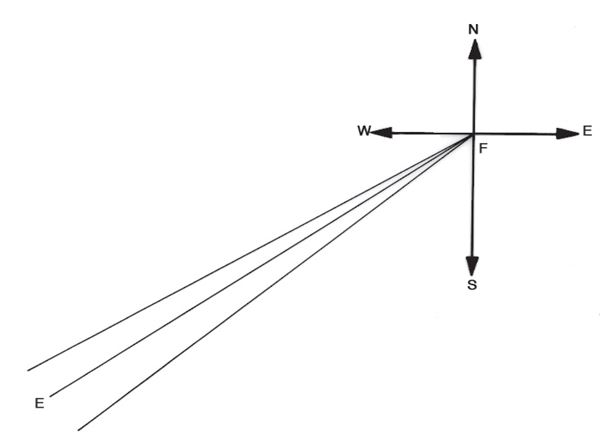
Using figure 1.7, find out the direction of F from E.
We can also find the direction of places on the map by drawing a compass at the centre of the map. Different places in Kenya are found in certain directions. For example, a compass drawn at the centre of Kenya, as shown in figure 1.8 helps us to understand that Kakamega County is found to the West of Kenya and Garissa County is found to the North-East of Kenya.
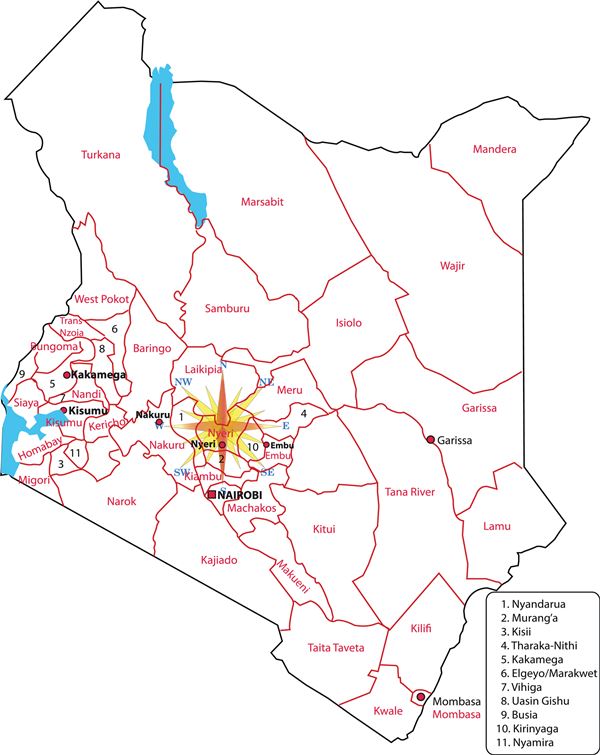
- In which direction is Mombasa County found on the map of Kenya?
- In which direction is Nairobi County found on the map of Kenya?
- In which direction is Lake Turkana County on the map of Kenya?
We can also use the compass points to tell the direction in which rivers are flowing on a map. You can do this by drawing a compass at the half-way distance of the river as shown in figure 1.9. You can tell where the rivers are flowing to by observing how tributaries join the main rivers. Where a river on a map does not have tributaries, you can tell the direction of flow by identifying the crops grown in the area. Tea, coffee or wheat grow in high areas, while cotton, and sugarcane grow in lowlands. You can then draw a compass in the middle of the river to help you tell the direction of flow of the river.
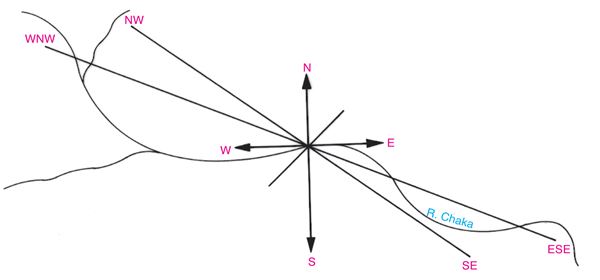
River Chaka is flowing from WNW to ESE.
Which one of the following sentences is incorrect?
- When a river on a map doesn't have tributaries, you can't tell in which way it flows.
- All maps are drawn facing the North direction.
- Cotton and sugarcane grow in lowlands.
- A compass can show 4, 8 or 16 points of direction.
Measuring distances on maps
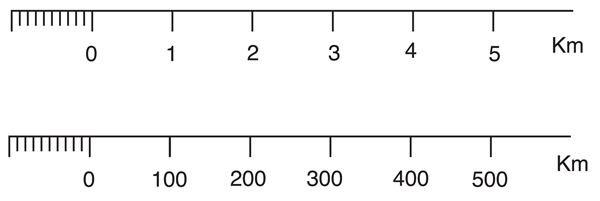
On each map, there is a scale drawn below it or on the sides. The scale shows the ratio between the distances on the map and the actual distances they represent on the ground. The scale is usually a line sub-divided into small equal units, one centimetre apart marked in the kilometres they represent on the ground. The first centimetre on the left is divided into metres, as shown in figure 1.10. Remember that different maps have different scales, depending on the distances they represent.
We can use the scale on maps to measure various distances such as distances between places, lengths of rivers, railway lines, roads, boundaries or hedges around a forest. This means that we can measure distances on straight lines or curved features like a river or roads as shown in figure 1.11(a) below.
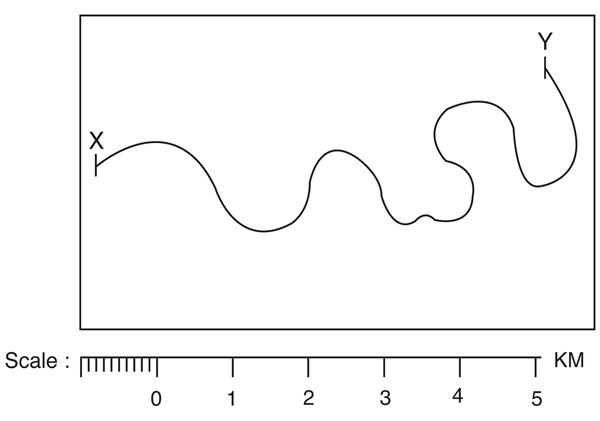
a) Measuring distances along straight lines
One can use an edge of a paper, string or thread. We can use point X and Y in figure 1.11 above, as an example. Let us take the following steps using an edge of a paper:
- Mark and join the two points.
- Fold the paper to have a sharp edge.
- Place the edge of the paper along the line and mark it X and Y.
- Transfer the paper and place it along the scale of the map. Point X should be on the 0 mark of the scale.
- Read out where Y falls on the scale. That is the distance between X and Y in kilometres.
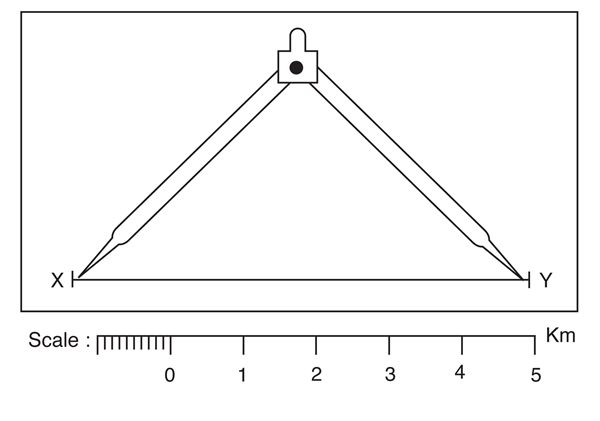
You can also use a string or thread the same way you used the pieces of paper to get the distance between X and Y. One can also use a pair of dividers and take the following steps:
- Join the two points X and Y.
- Open the pair of dividers, so that one point lies on X and the other on Y.
- If the distance between X and Y is longer than the opened dividers, divide the distance between X and Y into small sections to be covered by the dividers (see figure 1.11(b) above).
- Measure the sections and add them up to get the distance between X and Y.
- Transfer the distance covered by the dividers onto the scale.
- Read out the distance between X and Y.
What can be used for measuring distances on maps?
- scale of the map
- compass
- edge of a paper
- hand lens
- string
- thermometer
- dividers
- thread
b) Measuring distances along curved lines
Distances on curved lines include lengths of roads, rivers or railway lines. One may use an edge of a paper, thread, string, or pair of dividers. Where one chooses to use the edge of a paper, the following steps may be followed to get the distance between S and T as shown in figure 1.12:
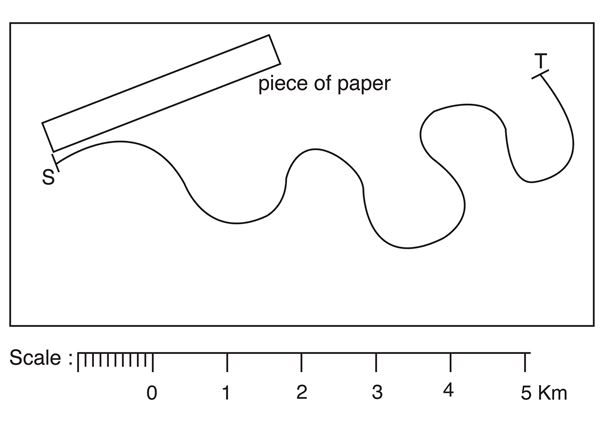
- Mark the points S and T.
- Sub-divide the line into straight portions using a pen.
- Place the edge of the paper or string along the curved line at S and mark it.
- Hold the paper firmly at S, using a pen.
- Move the paper on all straight sections without lifting it until you get to point T and mark it on the paper.
- Turn the paper on all straight sections without lifting it until you get to point T and mark it on the paper.
- Remove the paper marked S and T and place it on the scale and read out the distance between S and T.
Using a piece of thread measure the distance between S and T.
In case one uses a pair of dividers to get the distance between S and T, the following steps may be taken:
- Sub-divide the line S and T into straight portions.
- Number the straight portions 1, 2, 3 up to the last one.
- Using the pair of dividers measure each portion and transfer it to the scale and record the distance.
- Measure the distances of all the sections.
- Add up all the lengths of the portions to get the distance between S and T.
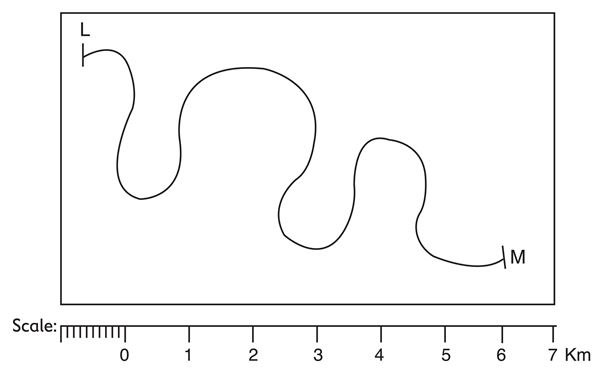
Using a pair of dividers, measure the distance between L and M in figure 1.13.
Calculating areas on maps
We can use the scale of a map to assist us in finding out the areas occupied by various features or regions on a map. The features may occupy various shapes. Some of them may be regular like triangles, squares, circles or rectangles. Once we know the scale of the map, we can use mathematical formulae to calculate and estimate the areas of various shapes.
The following mathematical formulae are used in calculating areas of regular shapes:
- Area of a square — length x width (l x w).
- Area of rectangle — length x width (l x w).
- Area of a triangle — half base x height (b x h).
- Area of a circle — π x radius x radius (πr2 ).
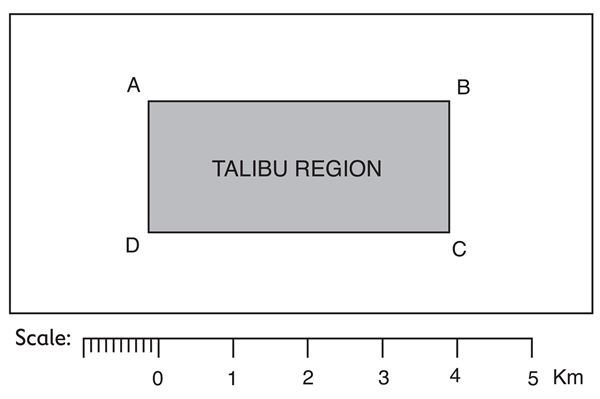
Let us use figure 1.14 to find out the area of some shapes.
To find the area of Talibu Region marked A, B, C and D, we can take the following steps:
- Measure the distance between A and B and transfer it on the scale.
- Measure the distance between B and C and transfer it on the scale.
- Multiply the distance between A and B by the distance between B and C.
- The result is the area of Talibu Region in square kilometres.
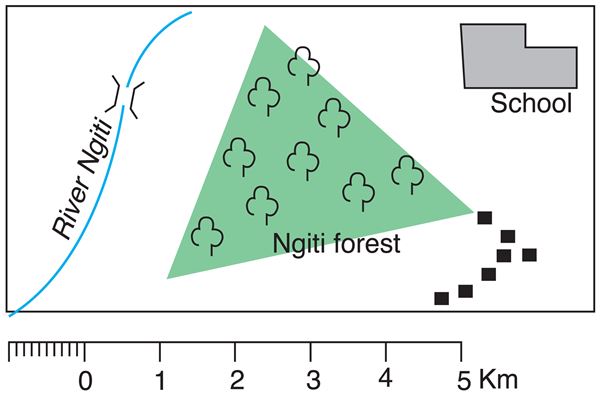
Find the area of Ngiti Forest in figure 1.15. Give your answer in square kilometers.
Some features on maps such as towns, forests, swamps, lakes, locations or districts have irregular shapes. In order to find the area occupied by such features, one can either draw squares or rectangular shapes on the maps or use a graph paper. Let us use figure 1.16 as an example.
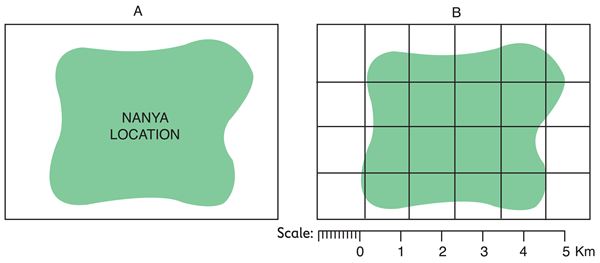
We can take the following steps to calculate the area of Nanya Location:
- Draw horizontal and vertical lines 1 cm apart in the shape so as to make equal squares.
- Transfer the distance on the map of each square on the scale.
- Since 1 cm on the map represents 1 km on the ground, the area for each square is 1 km2 .
- Count all the complete squares and multiply by 1 km.
- Count all the incomplete squares and multiply by km.
- Add the results of step 4 and that of step 5. The result is the area of Nanya Location.
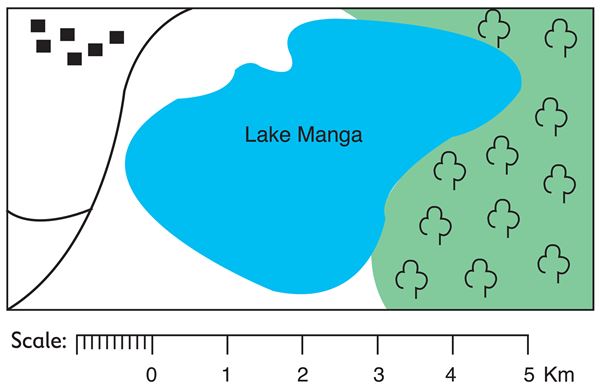
Using triangles, find out the area of the region occupied by Lake Manga in the sketch map below.
Work to Do
Study the map of Moromba Area and answer the questions that follow.
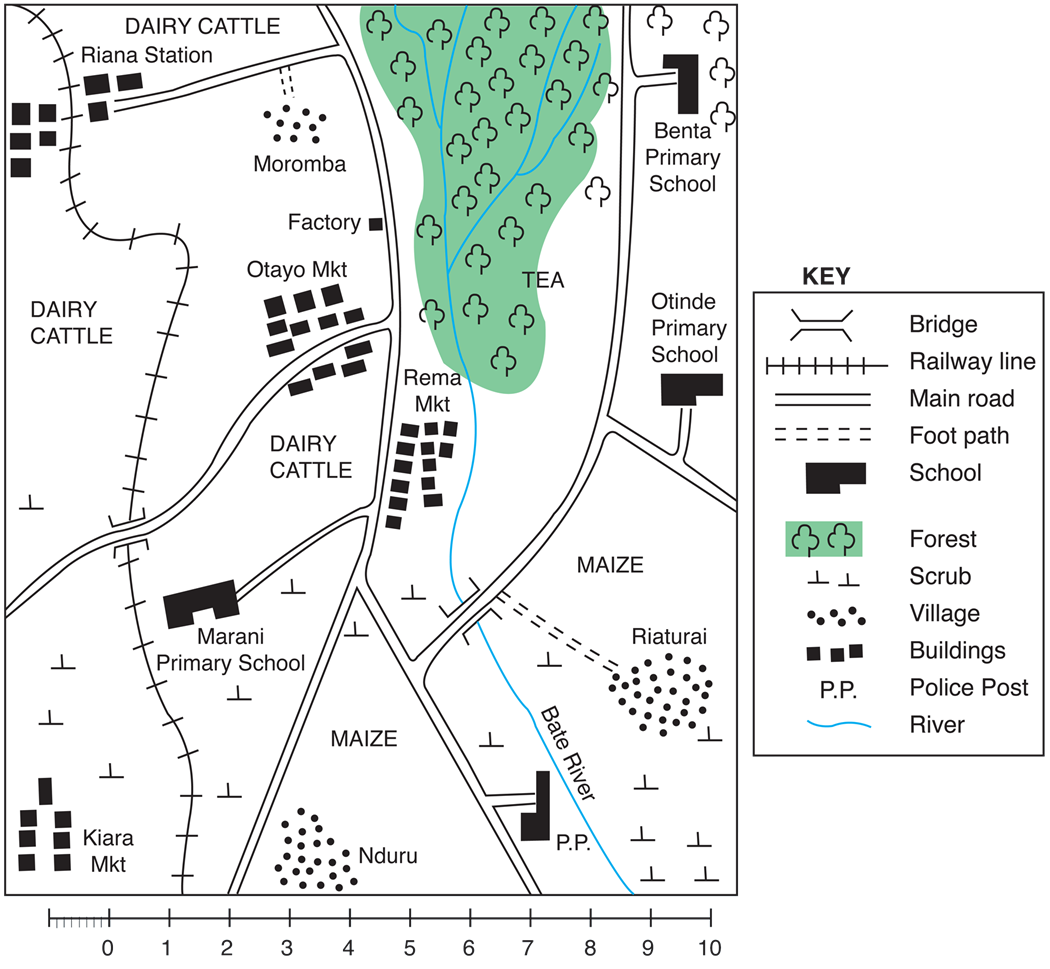
MOROMBA AREA